
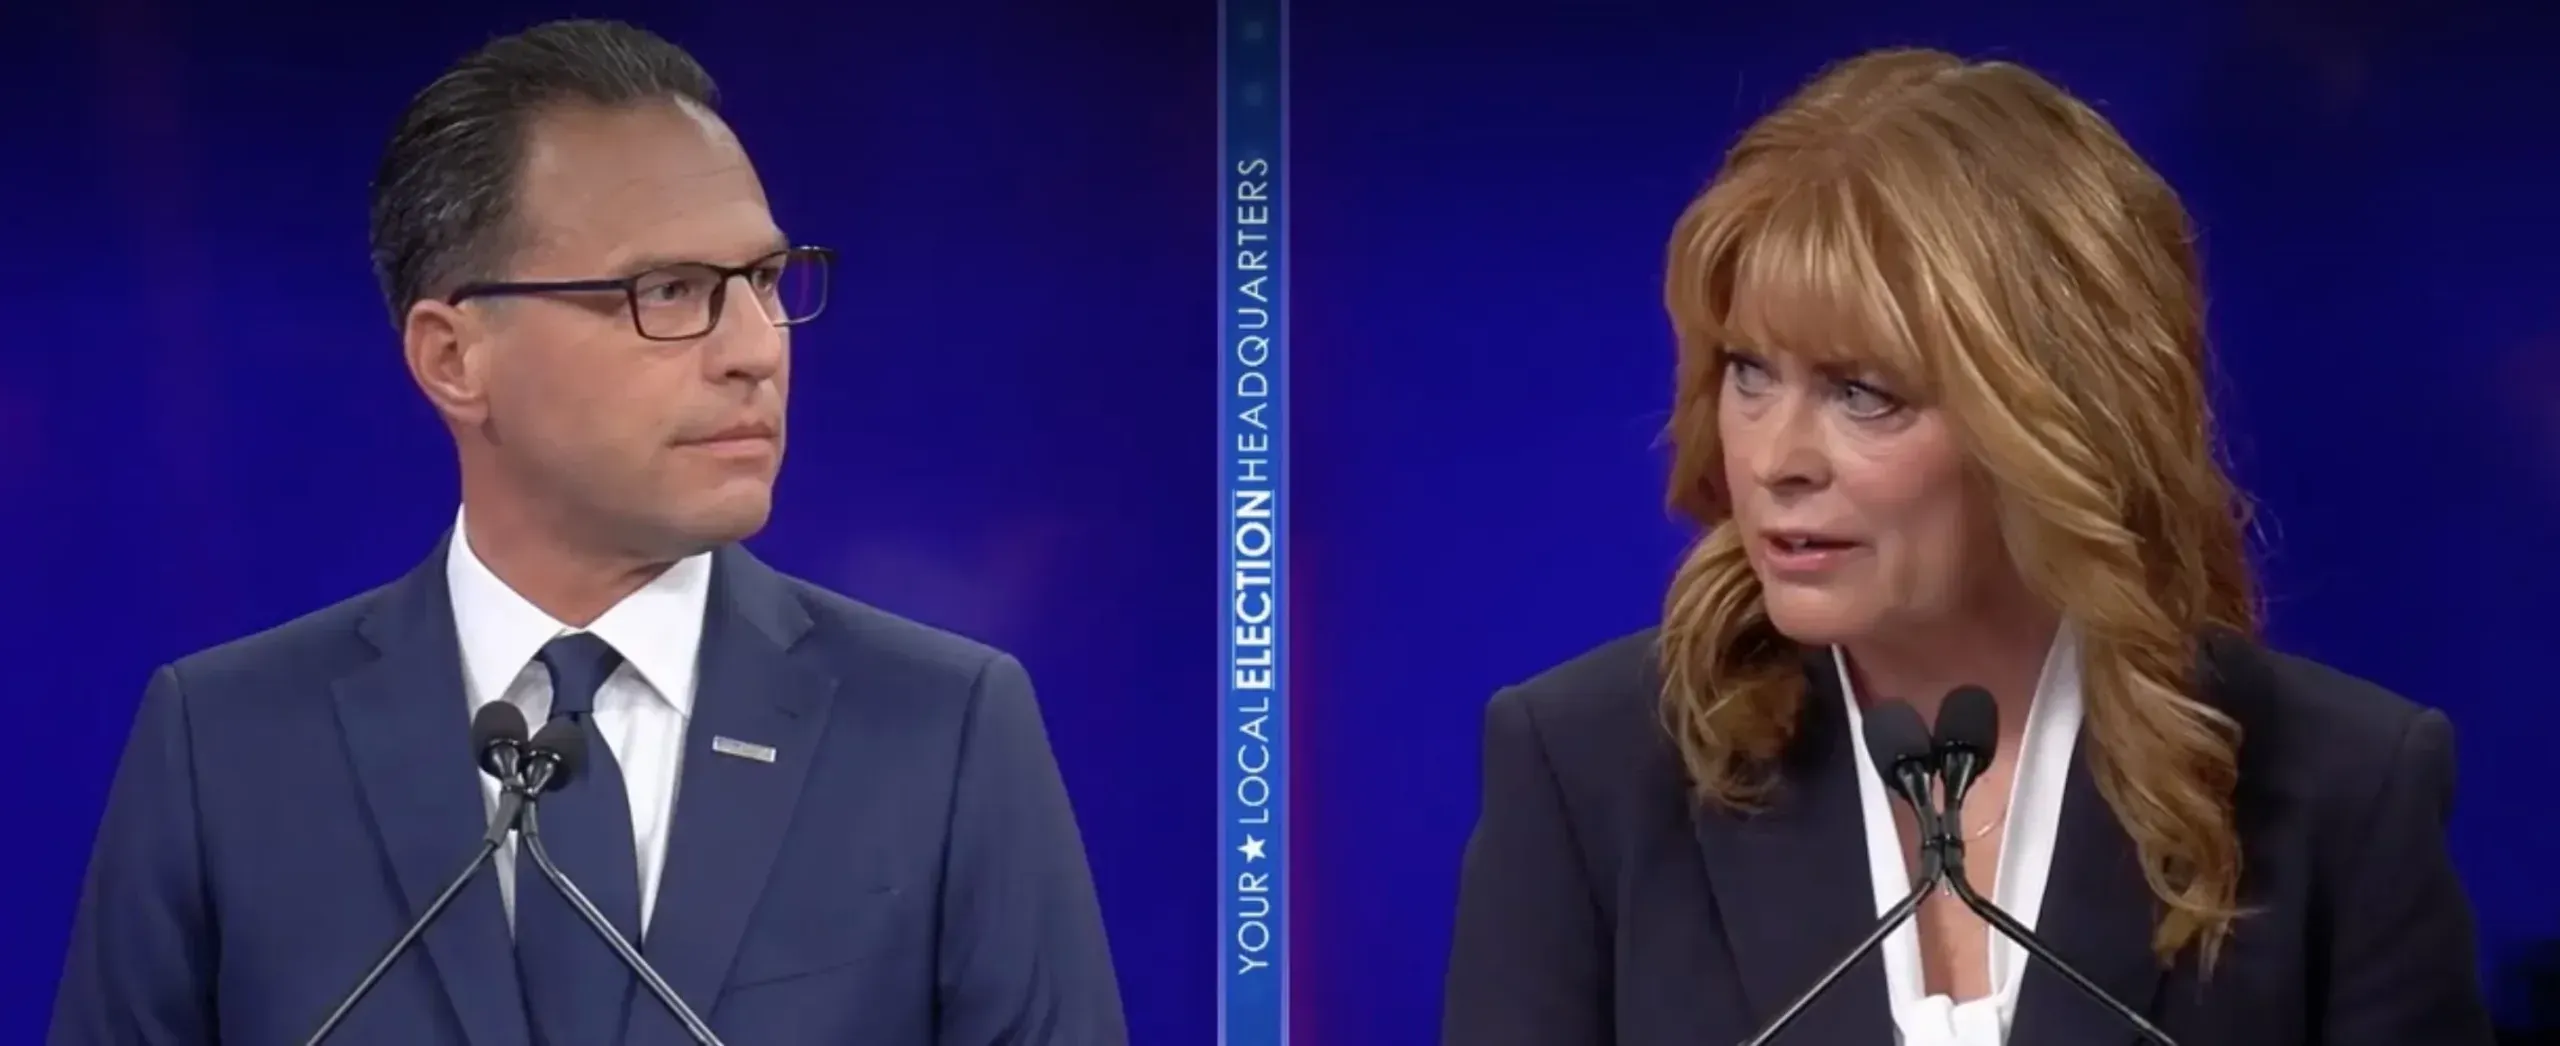
The numbers just keep looking better and better for Gov. Josh Shapiro as he campaigns for a second term in Harrisburg.
In the latest survey from the Center for Public Opinion at Franklin & Marshall College, Shapiro’s lead over Republican challenger Stacy Garrity is 22 points, 52-30%. This makes five consecutive polls that has the governor at least 20 points ahead of the state Treasurer.
One in eight surveyed (12%) indicated that they are still making up their mind as to who to cast their vote for. Of those, 20% are leaning toward Garrity compared to 17% for Shapiro, while 62 percent remained undecided.
| Poll | F&M October | Bravo October | Quinnipiac October | Susquehanna September | F&M August | Siena August |
| Josh Shapiro | 52% | 58% | 59% | 52% | 50% | 55% |
| Stacy Garrity | 30% | 28% | 34% | 31% | 25% | 39% |
Shapiro’s job approval ratings are positive considering how much economic pessimism voters currently express. Slightly fewer voters believe he is doing an “excellent” or “good” job (44%) as governor as believe he is doing a “fair” or “poor” job (48%).
The governor’s advantage in the gubernatorial race is a result of both the general positive views that voters have of him and the relative anonymity of Garrity—two in five (42%) voters say they do not know enough about her to have an opinion. Garrity is relatively unknown even among Republican voters. Shapiro is viewed more favorably (53%) than unfavorably (33%) among the state’s voters, while Garrity is viewed more unfavorably (35%) than favorably (22%).
Fewer voters believe President Donald Trump is doing an “excellent” or “good” job (29%) as president than believe he is doing a “fair” or “poor” job (70%), which is a sizable decline since our October 2025 poll when his positive approval rating was 41%. Only one in three (37%) registered voters believe that the President’s policies have helped them personally. Most Republicans (75%) think administration policies have helped them, but few Democrats (7%) or independent (31%) voters believe that. Republicans’ assessments about the personal effects of the president’s policies are consequential and are currently related to likelihood of voting. Among the 20 percent of Republicans who say Trump’s policies have hurt them personally, only two in five (39%) are likely to vote. Among the 75 percent of Republicans who believe the president’s policies have helped them, three in five (58%) are likely to vote.
Democrats currently lead Republicans by 14 points among likely voters, 56% to 42%, in their preferences for the US House of Representatives.
Do you think things are generally headed in the right direction or off on the wrong track?
Right Direction 37% (-4) | Wrong Track 48% (+3) | Do Not Know 15%
(#) percentage change since August poll
The most important problem facing Pennsylvania today?
Economy, Finances 21% | Government, Politicians 15% (+3) | Taxes 10% (-1) | Data Centers, AI 6%
Which political party do you think can do a better job of handling the problem you think is most important?
Democrats 38% | Republicans 35% (+4) | Neither 23% (-4) | Do not know 4%
Are you and your family better off, worse off, or about the same financially as a year ago?
Better off 13% (-1) | Worse off 45% (+1) | About the same 41%
How about a year from now?
Better off 20% | Worse off 32% | About the same 34% (-4)
Gov. Josh Shapiro: Excellent job 20% | Good 24% (-3) | Fair 24% | Poor 24% (+1)
Strongly Favorable Opinion 27% | Somewhat Favorable 26% | Somewhat Unfavorable 14% | Strongly Unfavorable 19% | Haven’t Heard Enough 14%
Stacy Garrity: Strongly Favorable Opinion 10% | Somewhat Favorable 12% | Somewhat Unfavorable 11% | Strongly Unfavorable 24% | Haven’t Heard Enough 42%
President Donald Trump: Excellent job 13% | Good 16% (+2) | Fair 13% (-1) | Poor 57% (-2)
Pennsylvania Governor: Josh Shapiro 52% (+2) | Stacy Garrity 30% (+5)
Generic Congressional: Democrat 48% | Republican 41% (+5) | Other 2% | Do Not Know 9% (-5)
If you do vote in November, do you plan to vote by mail-in ballot, by absentee ballot, or will you vote in person?: Mail 21% | Absentee 1% | In-Person 75%
Have you completed and returned your [absentee/mail-in] ballot, or not?
Yes 41% | No 58%
Federal agents will show up at some polling places on Election Day: Very concerned 24% | Somewhat concerned 20% | Not very concerned 13% | Not at all concerned 41%
There will be widespread election fraud: Very concerned 25% | Somewhat concerned 27% | Not very concerned 17% | Not at all concerned 30%
Non-citizens will vote in the election. Very concerned 30% | Somewhat concerned 15% | Not very concerned 15% | Not at all concerned 39%
The US Postal Services will fail to deliver some mail-in ballots in time for them to be counted: Very concerned 28% | Somewhat concerned 37% | Not very concerned 16% | Not at all concerned 15%
Will you vote in the November election?
Certain to vote 85% (+2) | Will probably vote 8% (-1) | Chances 50-50 will vote 6% (+1) | Don’t think will vote 2%
Are you paying attention to the 2026 elections?
Very much interested 56% (+1) | Somewhat interested 30% (-4) | Not very interested 13% (+3)
Do you follow what’s going on in government and politics?
Most of the time 57% (-2) | Some of the time 32% (+3) | Only now and then 7% (-1) | Hardly at all 4%
Flock Cameras: I want my community to use them 32% | I oppose their use by local police 61%
License Plate Readers: Strongly favor 15% | Somewhat favor 18% | Somewhat oppose 24% | Strongly oppose 41%
Who is more likely to misuse your private information?
Local government 7% | Technology company 37% | Both 50% | Neither 2%
Should state government be doing more to encourage people to get vaccinated for communicable diseases like the measles? Definitely yes 55% | Probably yes 15% | Probably no 11% | Definitely no 14%
Are vaccines used to prevent illness safe and effective? Definitely yes 55% | Probably yes 25% | Probably no 9% | Definitely no 9%
Attention to Politics: Most of the time 57% (-2) | Some of the time 32% (+3) | Now and Then 7% (-1) | Hardly at all 4%
Liberal, Moderate or Conservative: Liberal 26% | Moderate 36% | Conservative 34%
Creating More Laws to Regulate Gun Ownership: Strongly favor 38% | Somewhat favor 21% (-1) | Somewhat oppose 10% (-2) | Strongly oppose 28% (+2)
Abortion: Legal under any circumstances 39% (-1) | Legal under certain circumstances 45% (-2) | Illegal in all 14% (+2)
Toplines | Summary
The survey findings presented in this release are based on the results of interviews conducted October 7 – 18, 2026. The interviews were conducted at the Center for Opinion Research at Franklin & Marshall College. The data included in this release represent the responses of 808 registered Pennsylvania voters, including 340 Democrats, 331 Republicans, and 137 independents.The sample of voters was obtained from Aristotle. All sampled respondents were notified by mail about the survey. Interviews were completed over the phone and online depending on each respondent’s preference. Survey results were weighted (age, gender, education, geography, vote history, and party registration) using an iterative weighting algorithm to reflect the known distribution of those characteristics. Estimates for age, geography, and party registration are based on active voters within the Pennsylvania Department of State’s voter registration data. Gender and education are estimated using data from the November 2022 CPS Voter Registration Supplement.
The sample error for this survey is +/- 4.1 percentage points when the design effects from weighting are considered. The sample error for questions based on subgroups is larger and is +/- 5.6 percentage points for the likely voter sample. In addition to sampling error, this poll is also subject to other sources of non-sampling error. Generally speaking, two sources of error concern researchers most. Non-response bias is created when selected participants either choose not to participate in the survey or are unavailable for interviewing. Response errors are the product of the question and answer process. Surveys that rely on self-reported behaviors and attitudes are susceptible to biases related to the way respondents process and respond to survey questions.


